
Solving problems is considered an initial part of designers’ practice as they aim for user-centred design. The target that requires root-cause analysis of problems using tools such as the Fishbone diagram. A clear definition for the problem should be highlighted in order to target the proper solution, including analysing the causes behind this problem and its impact on the business. Tools such as TRIZ, SCAMPER Technique and Fishbone Diagram are commonly used to allow exploring a specific problem before providing the proper solution.
Related Articles:
What is the 8D Problem Solving? And How to use the 8D Report?
Using the TRIZ Method for Creative Problem Solving
Problem Solving Using Hurson’s Production Thinking Model
What is the Fishbone Diagram?
The Fishbone diagram (also known as the root-cause analysis and Ishikawa diagram) is used to identify the root causes of problems by identifying the different factors that may cause the problem. Based on the results, the team can build an effective solution to eliminating the problem.
The term, Fishbone Diagram, was first coined by professor Kaoru Ishikawa in his book “Introduction to Quality Control,” published in 1990. The diagram is also known as the Ishikawa Diagram, Cause and Effect Diagram, and Herringbone Diagram.
The Cause and Effect Diagram can be implemented during the development brainstorming session to discover the roots of a specific problem or identify the bottleneck in a particular process by categorising the causes of problems into six main types: people, methods, machines, materials, measurements, and environment. The categorisation of the cause of a problem varies based on the industry, such as the following:
- Manufacturing industry (5 Ms): Machine, Method, Material, Man Power, and Measurement
- Marketing industry (7 Ps): Product, Price, Place, Promotion, People, Process, and Physical Evidence
- Service industry (5 Ss): Surrounding, Suppliers, Systems, Skills, and Safety
The name Fishbone Diagram comes from the final shape of the diagram after analysing the problem because the structure looks like a fishbone, which is built gradually from right to left during the problem-solving session. The diagram starts with two main sections; Cause on the left and Effect on the right (video 1).
Video 1. Definition of the Fishbone Diagram.
Then, the possible causes of the problem are explored by creating branches from the line that link between cause and effect sections, as we will explore in the following example. While this diagram looks similar to other creative thinking methods, such as mind maps and starbursting, it focuses on solving problems rather than exploring ideas.
Using the Fishbone Diagram Example
To understand how the Cause-Effect Diagram works, we will explore an example of a problem and see how to use the Fishbone Diagram to investigate a problem, which is why a design studio company always fails to reach an innovative product or service.
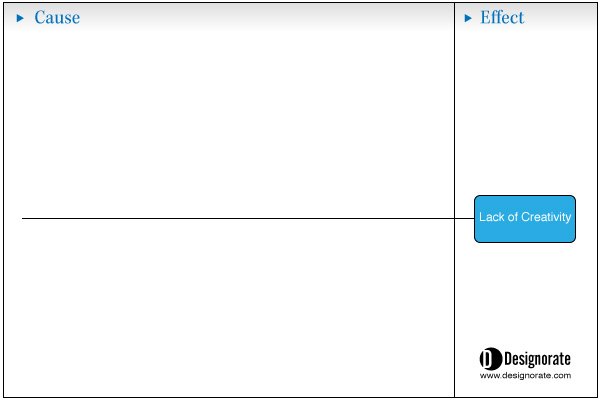
Step 1: Identify the problem (Effect)
The effect, or problem, results from one or multiple causes. Therefore, the problem should be clearly addressed to investigate the related causes. In the Design Studio example, we start by writing the Effect (Lack of Creativity) or the problem on the right side, as shown in the figure below.
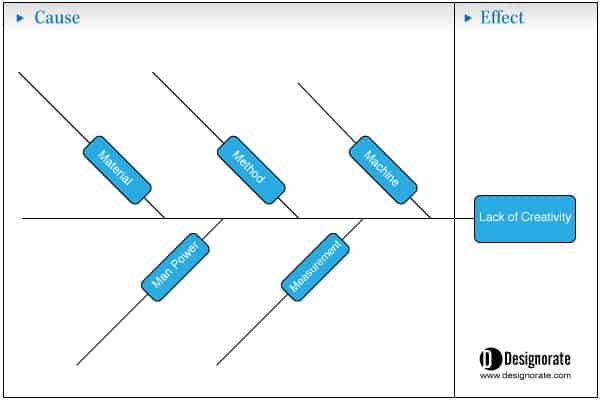
Step 2: Define the main causes model
Then, define the main categories of factors that can lead to the root causes of the problem. You can use any of the above highlighted three cause models. In this example, we’ll use the manufacturing industry model (5 Ms): Machine, Method, Material, Man Power, and Measurement.
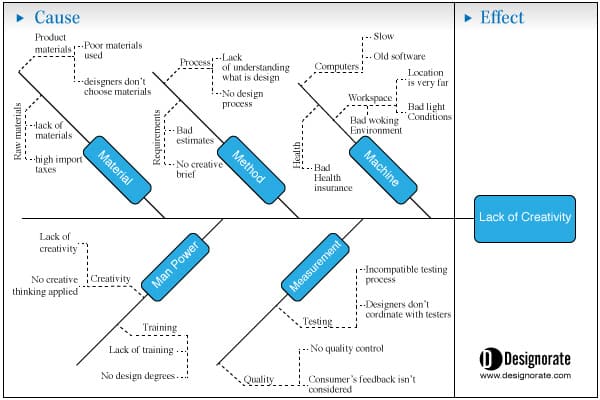
Step 3: Investigate possible causes of the problem
After drawing the main general categories, where we can add causes, the discussion starts to investigate all the possible causes for the problem and organize them under the five categories. For example, under Man Power, causes can be a lack of motivation, lack of skills, under-evaluated skills, hiring inappropriate skills, or fixed working hours.
Step 4: Analyse the findings
Once the diagram is complete, and causes are organized in the model, the next step is to investigate and discuss each possible cause and rank them based on their priority and influence on the problem. Understanding the different causes may include using research methods such as interviews, focus groups, and surveys.
The below video provides another example of how to use the Fishbone Diagram in identifying the root causes of problems.
Video 2. Example of how to apply the Ishikawa Diagram in identifying the root-causes of problems.
Further resources:
Solve It!: The Mindset and Tools of Smart Problem Solvers
Root Cause Analysis Handbook: A Guide to Efficient and Effective Incident Investigation
When it comes to problems, both designers and managers can fail to find the solution, and part of this failur
e is their inability to find the correct causes of problems. Many methods to achieve this goal, such as the Fishbone Diagram, investigate the relationship between the effect of the problem and its possible causes. In this tool, the causes are categorised and organised in the diagram to build a better understanding of how these causes contribute to the final problem and to order causes based on their priority as a means of addressing the problem in the final solution plan.
Article cover copyrights: Image by storyset on Freepik
Summary
The Fishbone diagram (also known as the root-cause analysis and Ishikawa diagram) is used to identify the root causes of problems by identifying the different factors that may cause the problem. Based on the results, the team can build an effective solution to eliminating the problem.
The steps to apply the Fishbone Diagram
- Identify the problem (Effect)
- Define the main causes model
- Manufacturing industry (5 Ms): Machine, Method, Material, Man Power, and Measurement
- Marketing industry (7 Ps): Product, Price, Place, Promotion, People, Process, and Physical Evidence
- Service industry (5 Ss): Surrounding, Suppliers, Systems, Skills, and Safety - Investigate possible causes of the problem
- Analyse the findings


Is there a tool with which I can create such a cause-effect diagram easily?
I'm sorry for the late reply as I was busy with my research. You can use online brainstorming tools such as Mural or Miro. It allows you to create the fish bone shape there.