
How to Use Decision Trees in the Decision-Making Process
Every day, designers face decision-making challenges on different levels of their careers. In many situations, uncertainty dominates the choices, especially when evaluating new ideas or introducing a new innovating product such as the Double-Diamond Design Thinking and the Stage-Gate Process. Think of the time you needed to determine the importance of project resources, find alternative solutions, or make business decisions. The decision-making process is a practice that we conduct daily. However, we sometimes need help to create an effective rational decision-making process rolling out any random intuitions or cognitive biases. We will explore applying the Decision Trees method during the decision-making process to address complex problems (check the System Thinking and 8D Problem Solving). The Decision trees are considered an efficient method to make decisions or solve problems under uncertainty to evaluate each choice based on the outcome and compare options based on these expected outcomes.
Related problem-solving articles:
- Problem-Solving Using Cause and Effect Diagram
- The Six Systems Thinking Steps to Solve Complex Problems
- Explore the 8D Problem Solving Approach
- Using the TRIZ Method for Creative Problem Solving
What is the Decision-Making Process?
The decision-making process refers to the steps or stages individuals or groups go through to identify and choose alternatives to solve a problem or make decisions. Although different models and frameworks were used to illustrate the decision-making process, a general decision-making process typically includes the following steps:
- Gather information: Collect relevant data, facts, and details about the problem or decision. This may involve conducting research, seeking expert opinions, or analysing available information.
- Identify criteria and goals: Determine the critical measures that will be used to evaluate the alternatives. Establish the goals and objectives the decision should achieve (Measuring the Impact of Design Thinking).
- Generate alternatives: Brainstorm and develop various options or solutions to address the problem or achieve the desired outcome.
- Evaluate alternatives: Assess each alternative against the established criteria and goals. Consider each option’s potential benefits, risks, costs, and consequences.
- Select the best alternative: Based on the evaluation, choose the alternative that best aligns with the established criteria and goals. This involves judging or weighing each option’s pros and cons.
- Implement the decision: Put the chosen alternative into action. Develop an action plan, allocate necessary resources, and assign responsibilities to execute the decision effectively.
- Monitor and evaluate: Continuously assess the implementation of the decision and its outcomes. Monitor progress, gather feedback, and make adjustments as necessary to ensure desired results are achieved.
It’s important to note that decision-making processes vary based on the complexity of the problem (check TRIZ Problem Solving method), the stakeholders involved, and the context in which the decision is being made. Additionally, some decision-making models may incorporate additional steps or emphasise different aspects of the process.
What is the Decision-Making Trees Method?
We can use several methodologies in decision-making; the Decision Tree method can be used as a tool or technique to support the decision-making process that can be used in different situations, such as problem-solving. Decision trees provide the decision makers with a structured approach for analysing complex decisions by breaking them down into smaller, more manageable components and taking action based on the resulting findings (check the SCAMPER technique).
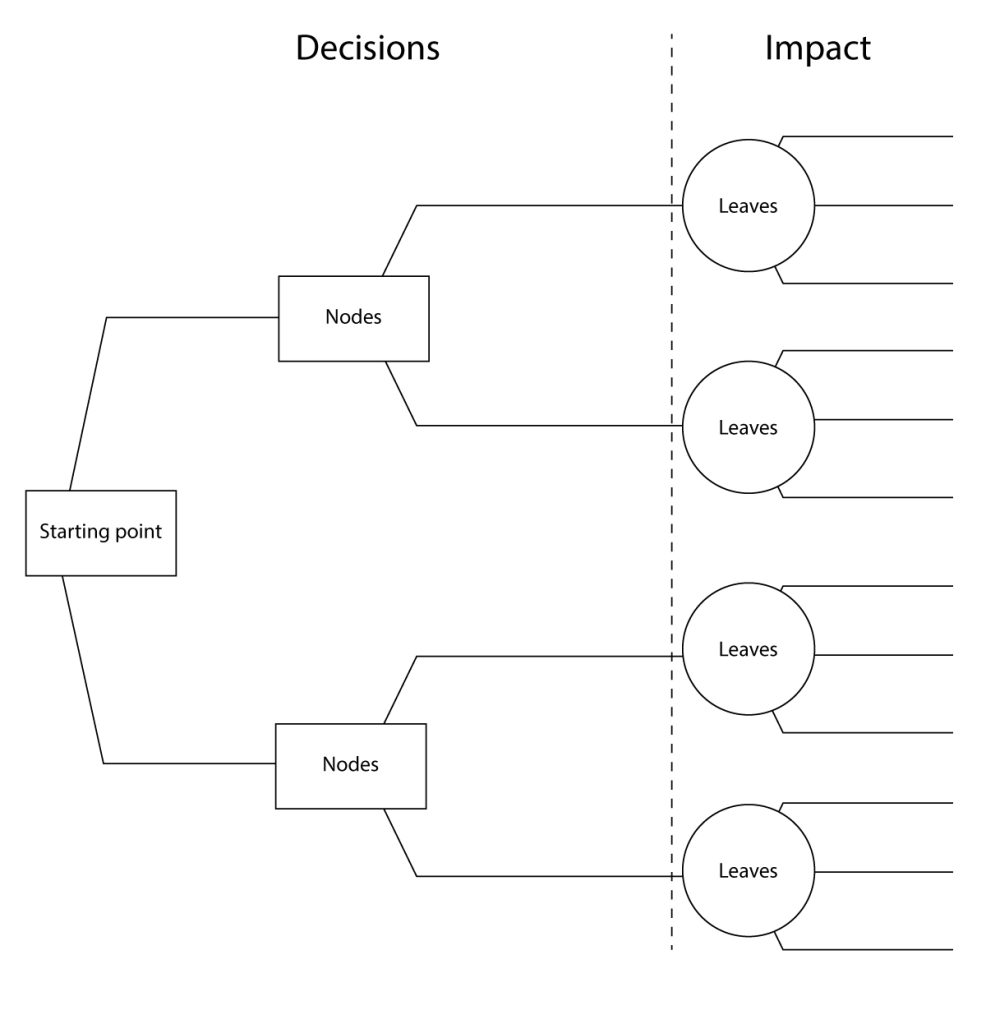
The decision trees are visual models that allow us to visually present all the choices associated with a problem and describe each option based on a probability value assigned to each choice outcome of a specific decision, including a group of related choices. The values of each choice are determined based on the probability value assigned to each expected outcome. The decision trees draw prospective decisions in a hierarchy representing the relationship between choices and outcomes. These outcomes are represented by two shapes: a square represents the decisions, while a circle represents the uncertain outcomes. Here is a basic outline of how a decision tree works:
- Starting point: The decision tree begins with the root node, representing the initial decision or problem.
- Branches and nodes: From the root node, branches emerge, each representing a possible decision or action. These branches lead to subsequent nodes, known as decision nodes, representing additional choices or actions that can be taken.
- Outcomes and probabilities: At the decision nodes, the branches further split into different paths, representing the potential outcomes or events resulting from the decision. These outcomes are connected to chance nodes, which display the probabilities of each outcome or the expected values.
- Leaves: The endpoints of the decision tree are called leaf nodes or terminal nodes. These nodes represent the outcomes or decisions reached based on the series of choices and probabilities.
- Evaluation and selection: To decide, one follows the path along the branches, considering the probabilities or values associated with each outcome. The objective is to choose how to maximise the expected value or achieve the desired result.
Decision trees can be used in various fields, including business, finance, healthcare, and data analysis (Fishbone Diagram for root-cause analysis). They are particularly useful when decisions involve multiple interconnected choices and uncertainties. Decision tree analysis allows individuals or groups to systematically analyse complex decision scenarios (Step-by-Step Guide to User Scenarios), compare various alternatives, and evaluate each option’s potential risks and rewards. By using the Decision Tree method in decision-making, individuals or groups can systematically analyse and evaluate complex decisions, consider multiple factors and potential outcomes, and make informed choices based on relevant information. `
Example of Applying the Decision Tree Technique in the Decision-Making Process
Drawing the Decision Trees
The decision tree starts with a small square with branches, and each branch represents the available input decision that must be considered during the decision-making process. Then, each branch can include more sub-branches based on the different available variables based on each decision branch. At the end of the branches, we draw uncertainty lines that represent the expected outcomes from each branch.
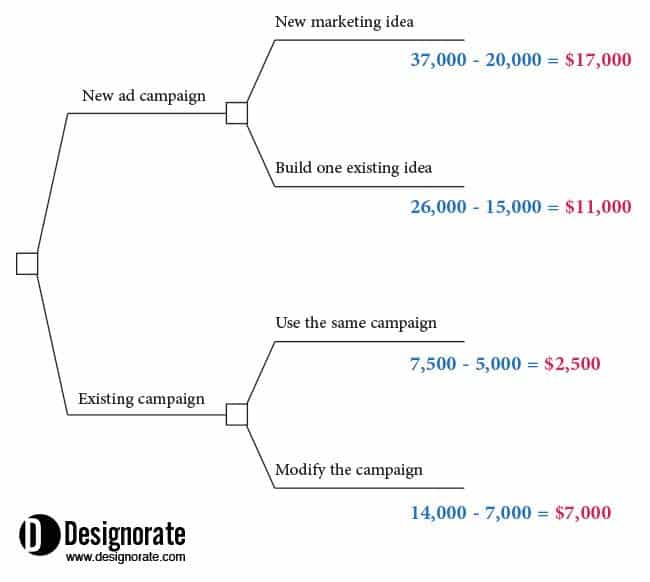
In the below example, we assume that we need to decide to create an advertising campaign for a television advertisement. So, we have two main choices: create a brand new campaign or modify an existing one. Two other decisions may arise in the new campaign branches: use a new marketing idea or build the campaign based on the existing campaign idea. With the second choice, to use a current campaign, we again have two decisions; here, we can either use the campaign as it is or modify the existing campaign to increase its exposure.
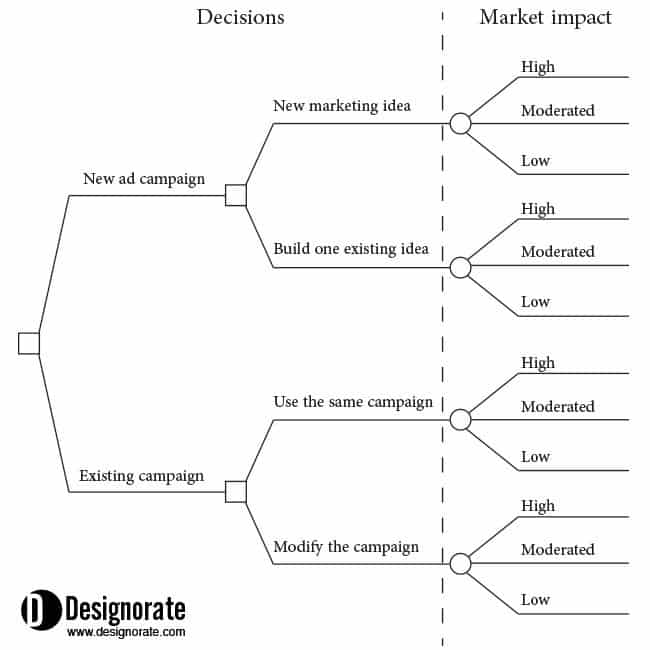
Once the decisions are drawn and highlighted with the square shape shown in the figure above, the uncertain outcomes are presented with a circle next to them. In this example, the outcomes indicate the market impact of the advertising campaign: low, moderated, or high.
Adding Rates and Values to the Decision Tree Outcome
After visualising all the decisions and uncertain outcomes on the decision tree, we need to add a rating for each outcome based on its expected strength. The rating can be either a percentage or a fraction of 1.0 for each outcome group. The total sum of all the values assigned to each decision outcome should be 100 per cent or 1.0. For example, the below values can be assigned to the use of a new marketing idea as follows: high (5%), moderated (3%), and low (2%). The percentage represents the probability of the outcome.
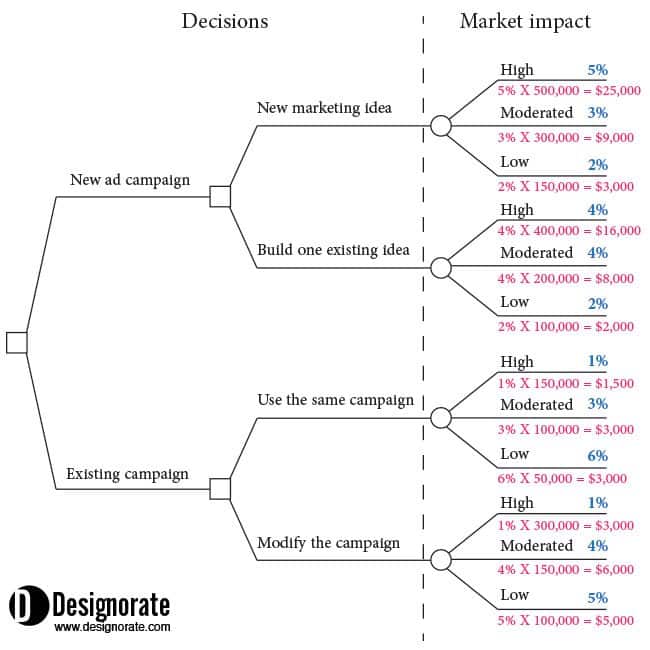
Then, we can write the expected gross revenues next to each outcome. For example, if the market impact of creating a new advertising campaign is high, then the expected revenues for the company will reach $500,000. If the outcome is moderated, the expected revenues will be $300,000.
After adding the probability value of each outcome and its expected revenues, the total outcome value is calculated by multiplying the probability value times the profit value. For example, the value for the new marketing idea option would be as follows:
5% X 500,000 = $25,000
3% X 300,000 = $9,000
2% X 150,000 = $3,000
Calculating the Decision Value in the Decision Tree
In the final step, after indicating the expected value next to each outcome, the overall value for each decision is calculated based on the sum of all the outcome possibilities minus the cost of each decision. For example, the total value of the three outcome possibilities in the first choice (a new marketing campaign) is:
25,000 (low) + 9,000 (moderated) + 3,000 (high) = $37,000
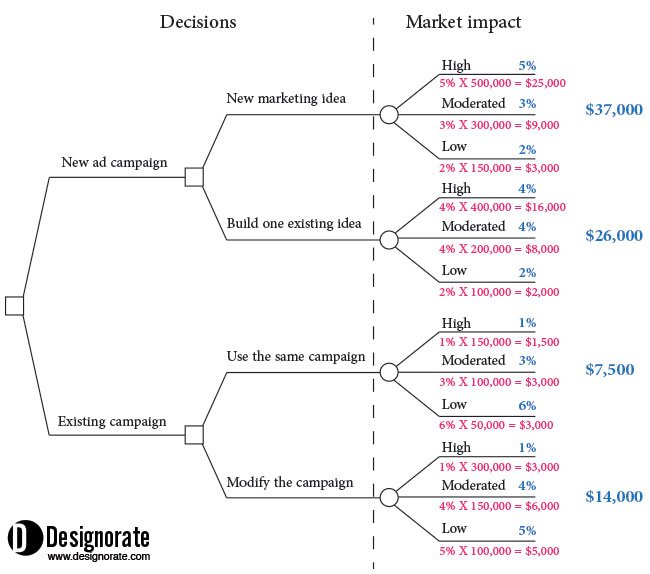
Then, we need to deduct the cost required to adopt this decision. To identify the next value of this specific decision, we would undertake the following:
37,000 (value) – 20,000 (cost)= $17,000 (net value)
So, the net value of the first decision (a new marketing campaign) will be $17,000. The same equation is applied to all the decisions to identify a net value for each decision. Then, the final result will show the decision with the highest value, which will be the proper decision.
When stuck for ideas, designers can depend on decision trees to give them a clue about the best decision to make based on calculating the probability of each decision and its values. While there are more complicated forms of decision trees, the above example provides a simple and straightforward method to apply the decision trees as individuals or during meetings to identify the proper decisions (What is Strategic Thinking? And How to Improve It). Furthermore, adding a visualisation process to these decision-making processes allows for a better understanding of the range of prospective options available. Uncertain situations can vary depending on multiple parameters and variables, which dectate the method to use to solve it and make the approperiate decision. The Decision Tree is one of those methods that can be used when you have an idea about the scenarios of each decision and you would liek to compare the impact of each one to be able to have a rational decision with evidence of its expected impact.